


Hello everyone! In this article, I'm going to be talking about service mesh, what it is and giving a practical example of applying a service mesh on a demo project I made using Istio and we'll be applying it on a Kubernetes cluster. We'll also install the Kiali dashboard alongside the service mesh which will provide us with almost real-time monitoring of our service mesh and services.
What is a service mesh?
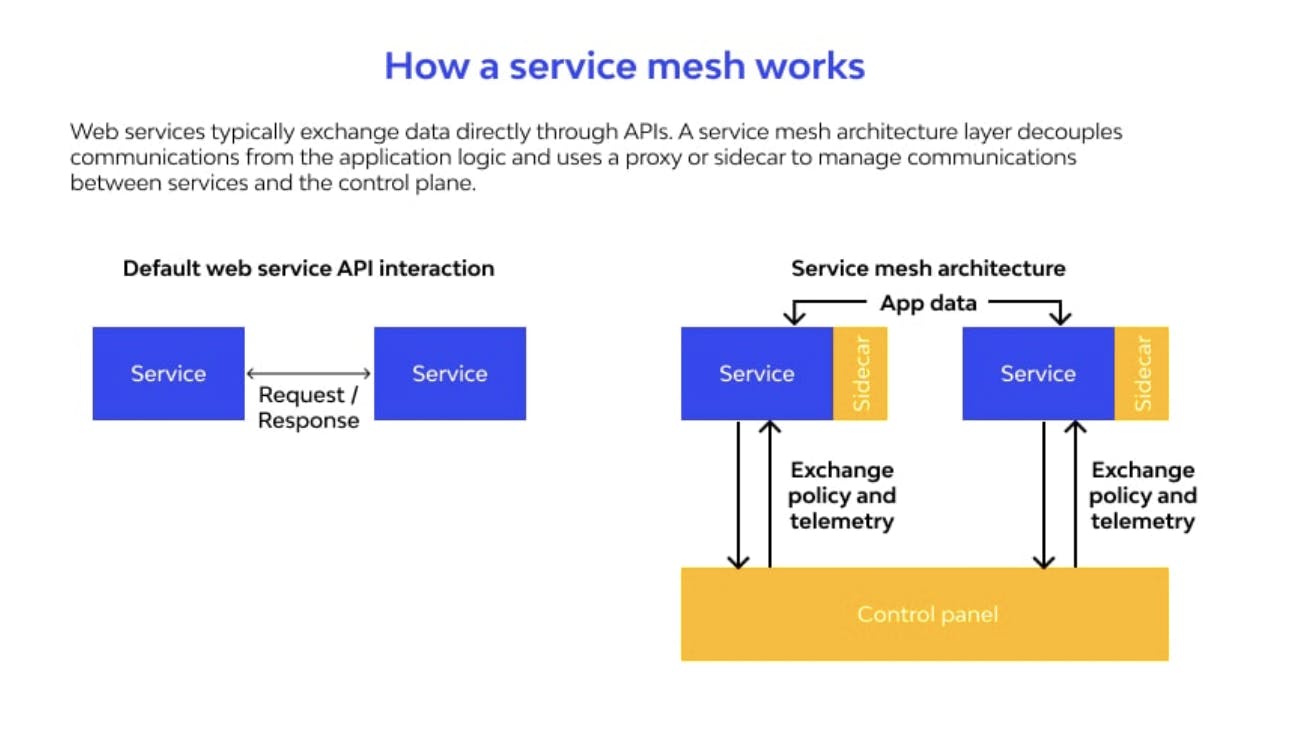
Service mesh is a unified solution to handling complex network communication between microservices, it is simply a dedicated infrastructure layer for managing service-to-service communication in a microservice architecture. It provides features such as traffic management, service discovery, load balancing, resilience, security, monitoring and more.
It is somewhat similar to the Kubernetes ingress in some ways but provides more out-of-the-box features than what the ingress offers, it gives a comprehensive solution for managing network traffic in a cluster. While it can provide ingress features its usability is more of a service-to-service internal cluster job.
How does a service mesh work?
Service mesh decouples any communication between services and itself. It isn't dependent on application logic it doesn't even need any code to be written in an application for it to work. What it uses is a single pod multi-container pattern called Sidecar which is simply a container other than the applications container that does work without the knowledge of the main application container. Enhances the application without it even knowing. It is deployed alongside the microservices themselves, providing a uniform way of communication, allowing each microservice to offload these concerns and focus on its business logic.
As we go through the demo I'll try to explain everything and hopefully, it all makes sense by the end of the article.
Istio
"Istio is an open-source service mesh that layers transparently onto existing distributed applications. Istio’s powerful features provide a uniform and more efficient way to secure, connect, and monitor services. Istio is the path to load balancing, service-to-service authentication, and monitoring – with few or no service code changes". This is from the Istio documentation which can be found here.
How does it work?
As we mentioned before it uses the Sidecar pattern to deploy what is called an Envoy Proxy next to each application, What Istio calls the data plane. These proxies are dynamically programmed with the specified configurations by what is called a Control Plane which continuously updates any changes applied.
Demo
Now after this brief introduction, let's apply a service mesh to a demo project I made, the demo project has 2 services;
A simple Web server made with GoLang that takes a temperature and converts it from the specified units provided
A Temperature converter service that takes the payload and converts the temperature as required.
Both services communicate together via gRPC (because why not). The temperature service is a gRPC server.
I dockerized both services and pushed them to the Docker hub publicly if anyone wants to follow along. Let's get started
Before getting started I recommend you have a local Kubernetes cluster installed, I use Minikube.
Download & Install Istio
# Download
curl -L https://istio.io/downloadIstio | sh -
cd istio-1.16.2
export PATH=$PWD/bin:$PATH

# Install
istioctl install --set profile=default
What we just did was download the Istio script & execute it, then add it to our PATH env variable.
After that, we chose a default profile for the Istio setup. Istio comes with different profiles out of the box with different configurations, the default one is convenient to showcase the functionality of Istio. More info here.
Now once we have our local Kubernetes cluster up and running, we need to add a label for our namespace to instruct Istio to automatically inject the Envoy proxies we talked about into every service.
kubectl label namespace default istio-injection=enabled
To check there are no errors execute
istioctl analyze
✔ No validation issues found when analyzing namespace: default.
Now, we'll apply our Kubernetes deployment & service files to get the cluster up and running.
API Deployment & Service
apiVersion: apps/v1
kind: Deployment
metadata:
  name: temperature-api
spec:
  replicas: 1
  selector:
    matchLabels:
      app: temperature-api
  template:
    metadata:
      labels:
        app: temperature-api
    spec:
      containers:
      - name: temperature-api
        image: amrelhewy/service-mesh-temp-api:1.0
        resources:
          limits:
            memory: "500Mi"
            cpu: "500m"
        ports:
        - containerPort: 3000
---
apiVersion: v1
kind: Service
metadata:
  name: temperature-api
spec:
  selector:
    app: temperature-api
  ports:
  - port: 3000
    name: http
Temperature Service Deployment & SVC
apiVersion: apps/v1
kind: Deployment
metadata:
  name: temperature-service
spec:
  replicas: 1
  selector:
    matchLabels:
      app: temperature-service
  template:
    metadata:
      labels:
        app: temperature-service
    spec:
      containers:
      - name: temperature-service
        image: amrelhewy/service-mesh-temp-service:1.0
        imagePullPolicy: IfNotPresent
        resources:
          limits:
            memory: "128Mi"
            cpu: "500m"
        ports:
        - containerPort: 8080
---
apiVersion: v1
kind: Service
metadata:
  name: temperature-service
spec:
  selector:
    app: temperature-service
  ports:
  - port: 8080
    name: http2-service
Paste them into 2 YAML files call them whatever you like & then apply them using
kubectl apply -f <file-name>.yaml
Execute the following command and re-execute till the status is changed to running.
kubectl get pods
If you followed everything up till now, we should have both services up and running perfectly. Let's try a simple test to check if everything is working as expected or not.
Port Forward the API server using
kubectl port-forward <api-pod-name> 3000:3000Now the API should be accessible from localhost:3000!
Execute the following curl command
 curl "http://localhost:3000?from=Celsius&to=Kelvin&temperature=150"

 # Response
 {"value":423.15,"unit":"Kelvin"}
To continue, we'll need to understand 2 main components of Istio; virtual services and gateways.
Istio Virtual Service
In Istio, a virtual service is a configuration object that defines the rules for routing incoming requests to the appropriate backend services. Virtual services provide a way to decouple the microservices architecture of your application from the underlying network infrastructure and make it possible to manage the traffic routing centrally and consistently.
A virtual service in Istio specifies the host names, paths, and ports that incoming requests should match, as well as the backend services to which the requests should be directed. It can also define the weight of traffic to be sent to each backend service, allowing for easy canary deployments or traffic shifting for testing and rollouts.
A typical use case is to send traffic to different versions of a service, specified as service subsets. Clients send requests to the virtual service host as if it was a single entity, and Envoy then routes the traffic to the different versions depending on the virtual service rules: for example, “20% of calls go to the new version” or “calls from these users go to version 2”. This allows you to, for instance, create a canary rollout where you gradually increase the percentage of traffic that’s sent to a new service version. More info here
Istio Gateway
You use a gateway to manage inbound and outbound traffic for your mesh, letting you specify which traffic you want to enter or leave the mesh.
Gateways are primarily used to manage ingress traffic.
Follow these instructions to successfully add a Gateway along with a Virtual Service:
The gateway of Istio is backed by a Kubernetes load balancer type service, it exists in the namespace Istio-system, we'll need to export the following environment variables for later use:
 export INGRESS_NAME=istio-ingressgateway
 export INGRESS_NS=istio-system
Now execute the following to check if the load balancer service "Gateway" exists
kubectl get svc "$INGRESS_NAME" -n "$INGRESS_NS"
Now export the following env variables
export INGRESS_HOST=$(kubectl -n "$INGRESS_NS" get service "$INGRESS_NAME" -o jsonpath='{.status.loadBalancer.ingress[0].ip}')
export INGRESS_PORT=$(kubectl -n "$INGRESS_NS" get service "$INGRESS_NAME" -o jsonpath='{.spec.ports[?(@.name=="http2")].port}')
Now we need to apply a gateway configuration telling Istio what to exactly do.
apiVersion: networking.istio.io/v1alpha3
kind: Gateway
metadata:
  name: api-gateway
spec:
  selector:
    istio: ingressgateway # use istio default controller
  servers:
  - port:
      number: 80
      name: http
      protocol: HTTP
    hosts:
    - "*"
---
apiVersion: networking.istio.io/v1alpha3
kind: VirtualService
metadata:
  name: temperature-api
spec:
  hosts:
  - temperature-api
  gateways:
  - api-gateway
  http:
  - route:
    - destination:
        host: temperature-api
This tells the gateway to send any incoming traffic to the temperature api service. Note that this is a basic usage of the gateway and it offers much more advanced and complex features.
Now before checking if everything works, we'll need to execute a command to encapsulate our local network within the Kubernetes cluster network aka Tunneling.
minikube tunnel
Now we can export a GATEWAY_URL env variable before checking everything.
export GATEWAY_URL=$INGRESS_HOST:$INGRESS_PORT
Now if we send a curl request to the previous end variable, we should get the same response.
curl -s "http://${GATEWAY_URL}?from=Celsius&to=Kelvin&temperature=150"

# Response {"value":423.15,"unit":"Kelvin"}
Integrating with Kiali
Now we'd want to visualize our services and requests. We'll be installing the Kiali dashboard alongside Istio to do so. To install we'll start by installing Kiali in our cluster.
kubectl apply -f https://raw.githubusercontent.com/istio/istio/release-1.17/samples/addons/kiali.yaml
To verify that it's running execute the following command and there should exist a service. (Kiali get's installed in the istio-system namespace)
kubectl -n istio-system get svc kiali
Kiali requires Prometheus as the monitoring and telemetry tool, Prometheus gathers all the data and Kiali displays it simply.
To install Prometheus to our cluster run the following
kubectl apply -f https://raw.githubusercontent.com/istio/istio/release-1.17/samples/addons/prometheus.yaml
To open the dashboard, simply run
istioctl dashboard kiali
Now if you execute the curl command we previously did 4 or 5 times curl -s "http://${GATEWAY_URL}?from=Celsius&to=Kelvin&temperature=150" and go to the graph part we should see something that looks like this
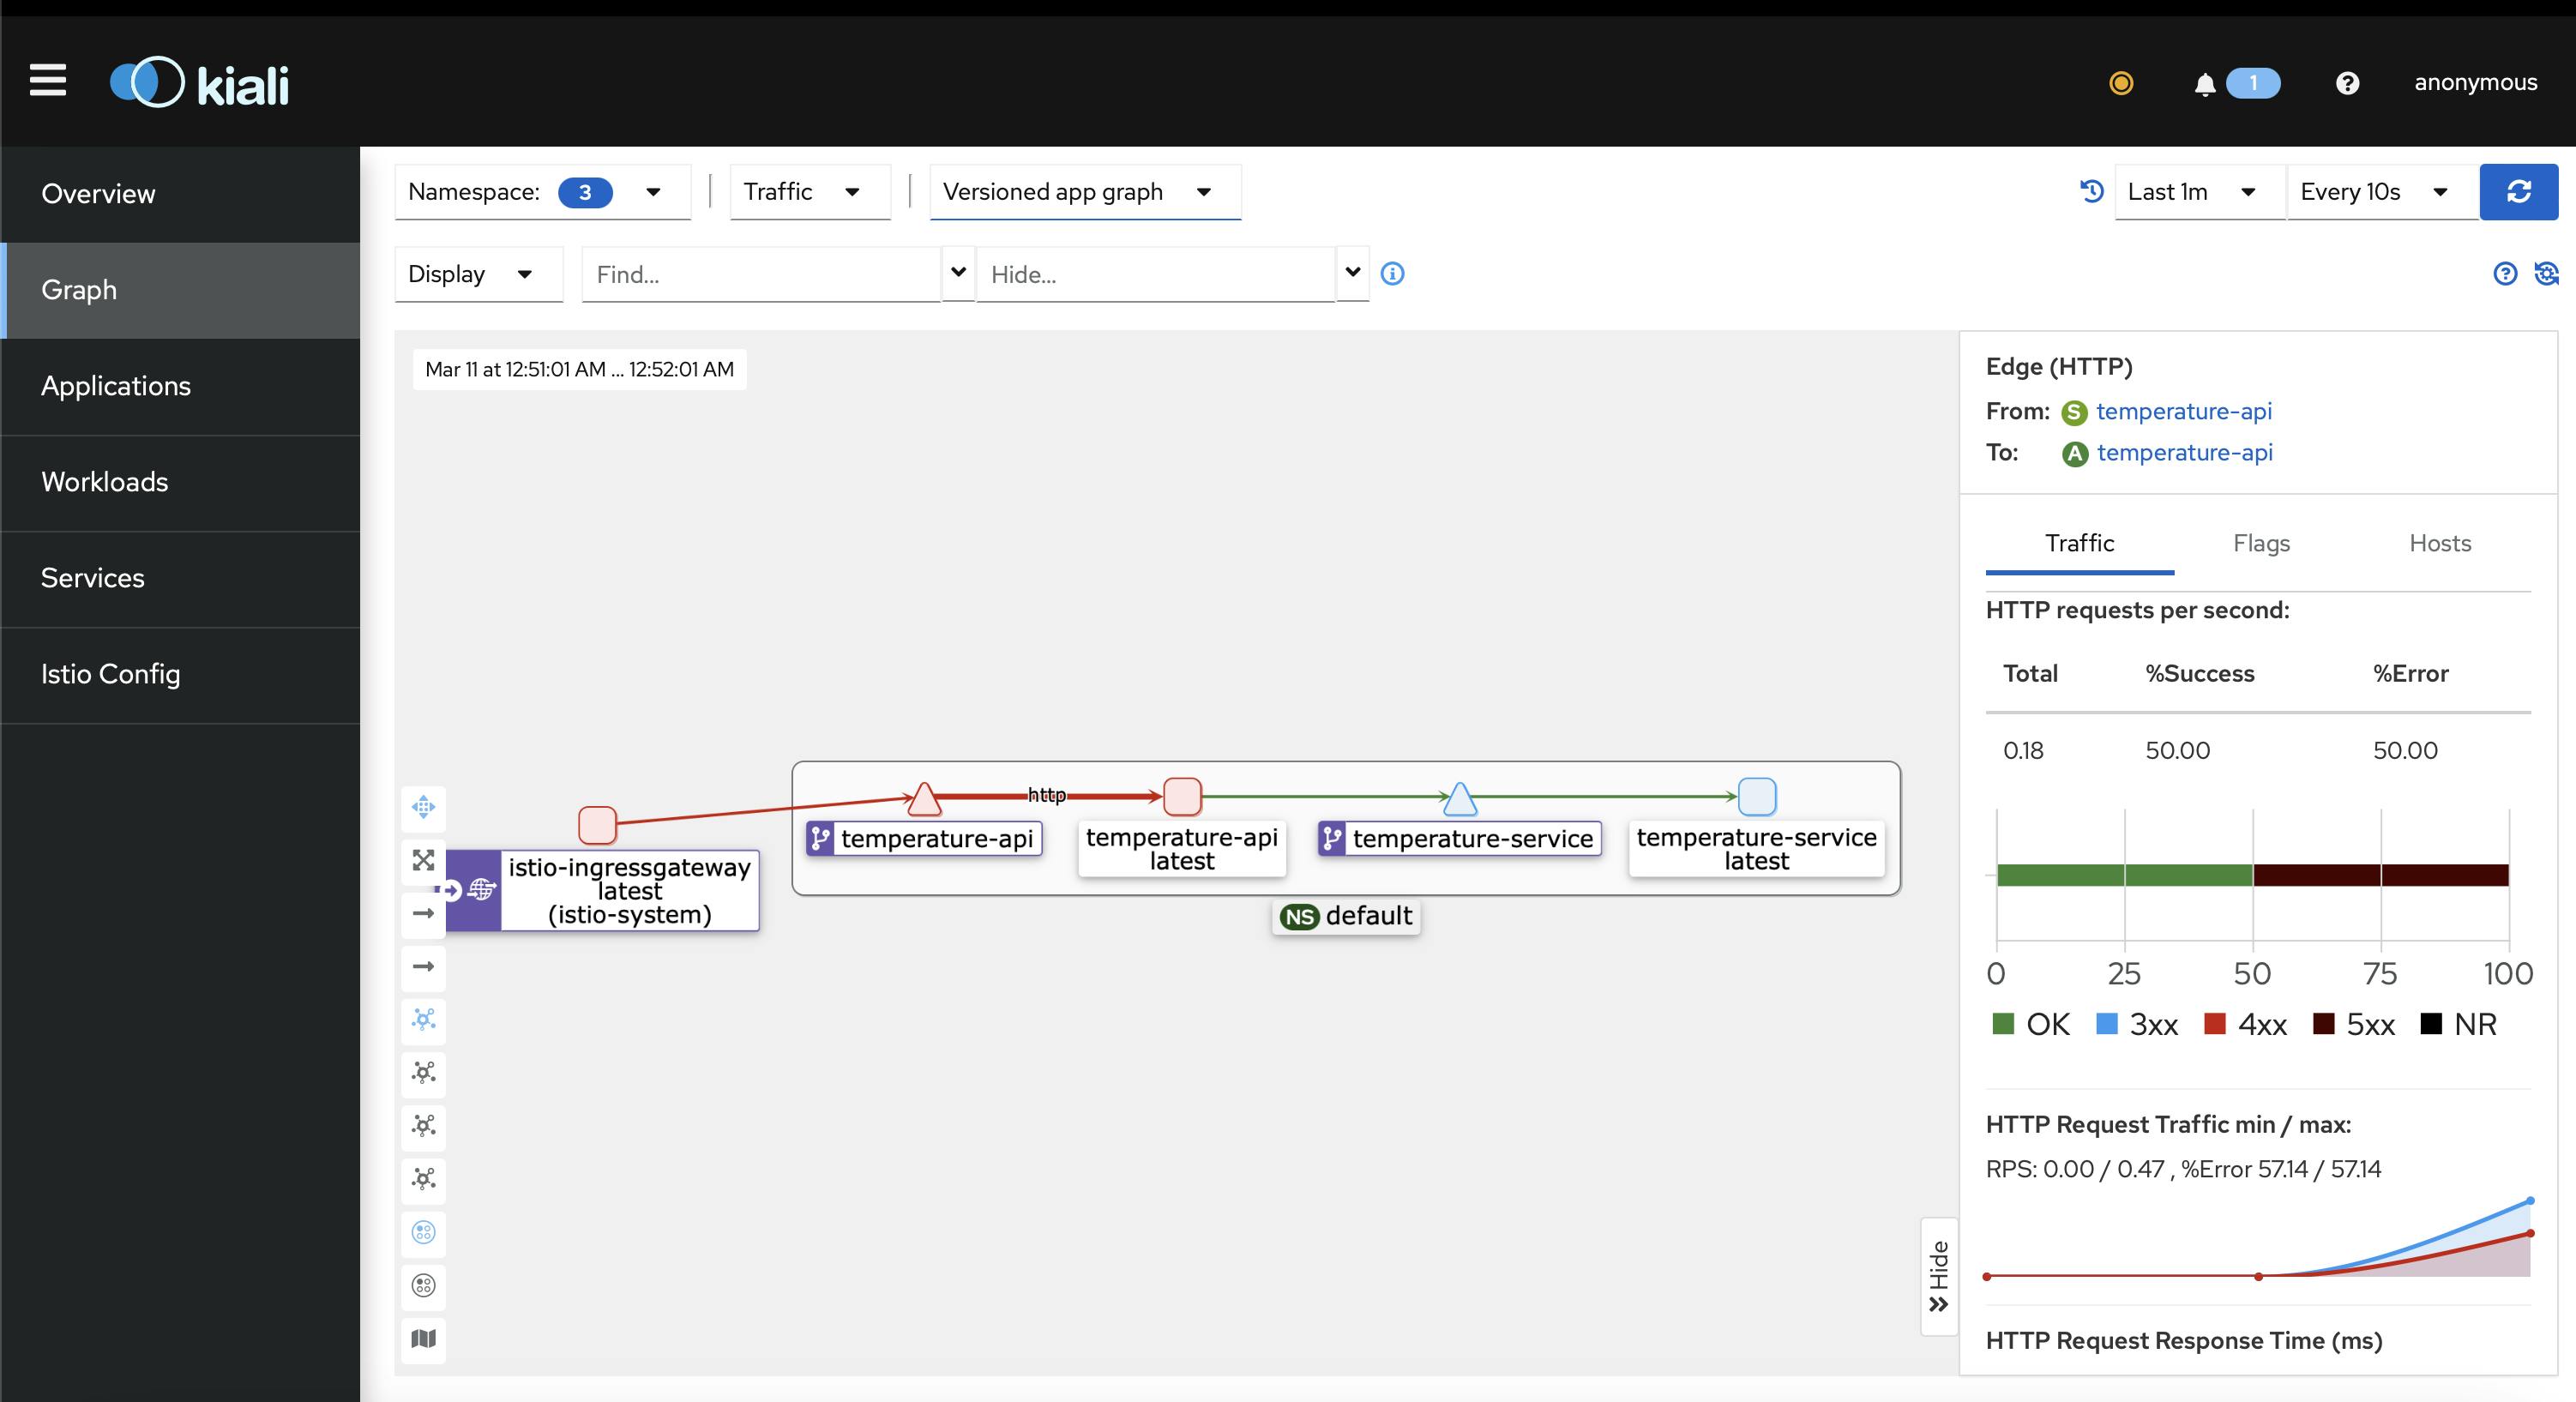
Where this graph displays all our services (in our case we have 2) and the red line indicates that a request failed in the service connected to that line as we see on the right-hand side. It's a very very useful tool to display different requests flowing in a microservices architecture.
Wrapping up
Service mesh is a very interesting topic and I enjoyed making this article very much. Hope anyone got anything out of it and till the next time!