


Hello everyone! For the first article for the new year, I wanted to talk about a really interesting topic that I find to be very useful in practice. But before we start we need to give some definitions that would help us throughout the article
What is observability in the first place?
It's simply having the ability to identify any state that your system got into without having to ship any code. It's completely different than traditional monitoring and metrics collection, observability is a deeper understanding. Traditional monitoring may and will be useful in some cases but on a large scale where you're searching for a needle in a haystack it won't be that beneficial for you. So definitely having a deep understanding of every system state is very important to solve complex problems
What are the benefits of observability?
The most important thing observability provides is instead of the senior engineer in a certain team being the most knowledgeable one and being the one that has faced most issues in a system, it becomes the most curious member of the team and allows flexibility in the part that no matter how long a certain team member has been on the team, with the right observability he can jump right into solving any issue.
So the oldest team member doesn't have to always be the one that has to get paged or bothered whenever a certain issue occurs.
Now before diving into tracing, we need to talk about events in a system.
Events
An event is nothing more than just a step to accomplish the final result, for example in a server request where the request has to talk to several external services before returning a response, each service is considered an event in the request cycle. It's a matter of seeing how many things a computation needs to do independently before returning the final result.
With the use of logging, you can add all the relevant information you'd need for a specific event.
Tracing
It's the process of stitching all events together where you can have a complete outlook on your request seeing different information related to different parts of your code.
When you gather all logs for all the different events that happened for a particular request, you can then aggregate these event logs and slice and dice different dimensions until you find what you're looking for.
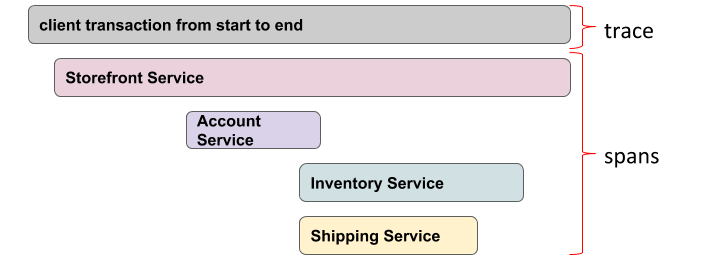
In the visualization world, a trace consists of several trace spans or spans for abbreviation, each span represents an event or in other words something happening.
The root span has no parent. However, spans can have several children and can create a sort of hierarchy as we see in the figure below the root span has 1 child and that child itself has 3 different descendants from it. The figure below represents a waterfall visualization which is a visualization technique showing the start and finish of every span in the request
Implementing tracing without any library
I'll show a quick demo on implementing the idea or concept of tracing using Go below. However, there are a lot of open-source libraries that provide out-of-the-box implementations for such things. One I would recommend checking out is OpenTelemetry which has brilliant documentation and is compatible with many programming languages.
Let's say we have an endpoint in our application and we issue a GET request to it, the request then proceeds to make two calls to other services to retrieve data based on the payload of the request and then returns the results.
func rootHandler(r *http.Request, w http.ResponseWriter){
    authorized := callAuthService(r)
    name := callNameService(r)
    if authorized{
        w.Write([]byte("Success"))
    }else{
        w.Write([]byte("Unauthorized"))
    }
}
Now tracing should follow this request as it traverses multiple services. So we should expect to see a minimum of three spans at the length of this request
The originating request's span which is the root span in our case
The call to the authorization service which is a child of the root span
The call to the name service which also is a child of the root span
For each trace, we'll need to generate a unique trace ID for each single request so that we can forward the trace ID among the spans and group them back together once the request finishes. We'll use UUID for this case. Also let's assume our backend already sends the trace to a backend store where it undergoes processing of the data collected to be able to use it afterwards. We're only focusing about our endpoint's instrumentation here.
func rootHandler(r *http.Request, w http.ResponseWriter){
    traceData := make(map[string]interface{})
    traceData["trace_id"] = uuid.String()
    traceData["span_id"] = uuid.String()
    // main work of request
}
We'll use a hashmap that propagates through different spans of the request and gets populated accordingly, However we will also need to know the duration of each span and possibly add some extra information for each span specifically if we wanted to.
We'll need to capture a timestamp for our spans start and finish and get the difference between them.
func rootHandler(r *http.Request, w http.ResponseWriter){
    // trace data setup from above
    startTime := time.Now()
    traceData["timestamp"] = startTime.Unix()
    // main work of request
    traceData["duration_ms"] = time.Now().Sub(startTime)
    traceData["service_name"] = "rootHandler"

    sendSpan(traceData) // sends data to backend for processing
}
We can also add custom fields as i mentioned above, so maybe adding the service name as well as what exactly the current span is doing would be beneficial.
Then finally for each span after adding everything needed for observability, we send the traceData to be processed in the backend where it gets grouped with every other span from the same trace ID specified.
How do we relate and connect all the services together so that they belong to the same trace?
The implementation of such thing would differ from system to system, for example if its just one monolith we can pass that information to each service we call. In distributed systems if we made an HTTP request for example we can set any named headers (as long as we know the name on both sides we should be fine) and send the trace id along with the parent span id too.
Typically HTTP headers follow a particular standard, such as (W3C or B3), using the B3 standard the specified headers would be X-B3-TraceId and X-B3-ParentSpanId.
So if we adjusted our for example callAuthService method we can send the hashmap traceData to it, extract the trace id and use the span id as the parent span id and send it as headers before actually calling the external service.
func callAuthService(r *http.Request, traceData     map[string]interface{}){
    aReq,_ = http.NewRequest("GET", "http://auth/check", nil)
    aReq.Header.Set("X-B3-TraceId", traceData["trace_id"])
    aReq.Header.Set("X-B3-ParentSpanId", traceData["span_id"])
    // make the request
}
The same thing goes with the callNameService function as well. Then each service sends its generated spans to a tracing backend that processes these spans and stitches them together to create a for example water-fall type visualization that we want to see.
Summary
Events are the building blocks of observability and traces are interrelated series of events. Stitching all those events together is very useful for observability. This was just a brief on a really interesting topic I found and wanted to share. If you reached here thanks for your time and till the next one!